My Blog
COVID ExploreR Application
Link to Shiny Application
COVID ExploreR - Interactive Visual Analysis with R Shiny for Exploring COVID-19 Data
Project Proposal
User Guide
Step-by-step guide on how to use the data visualisation functions designed
Poster
A Visual Analytics Application practice and research.
Practice Research Paper
A Visual Analytics Application practice and research.
COVID-19: death statistics
This post is on the planning and prototyping process for one of the three sub-modules of a Shiny-based Visual Analytics Application project for the course *ISSS608 - Visual Analytics and Applications* offered in SMU MITB.
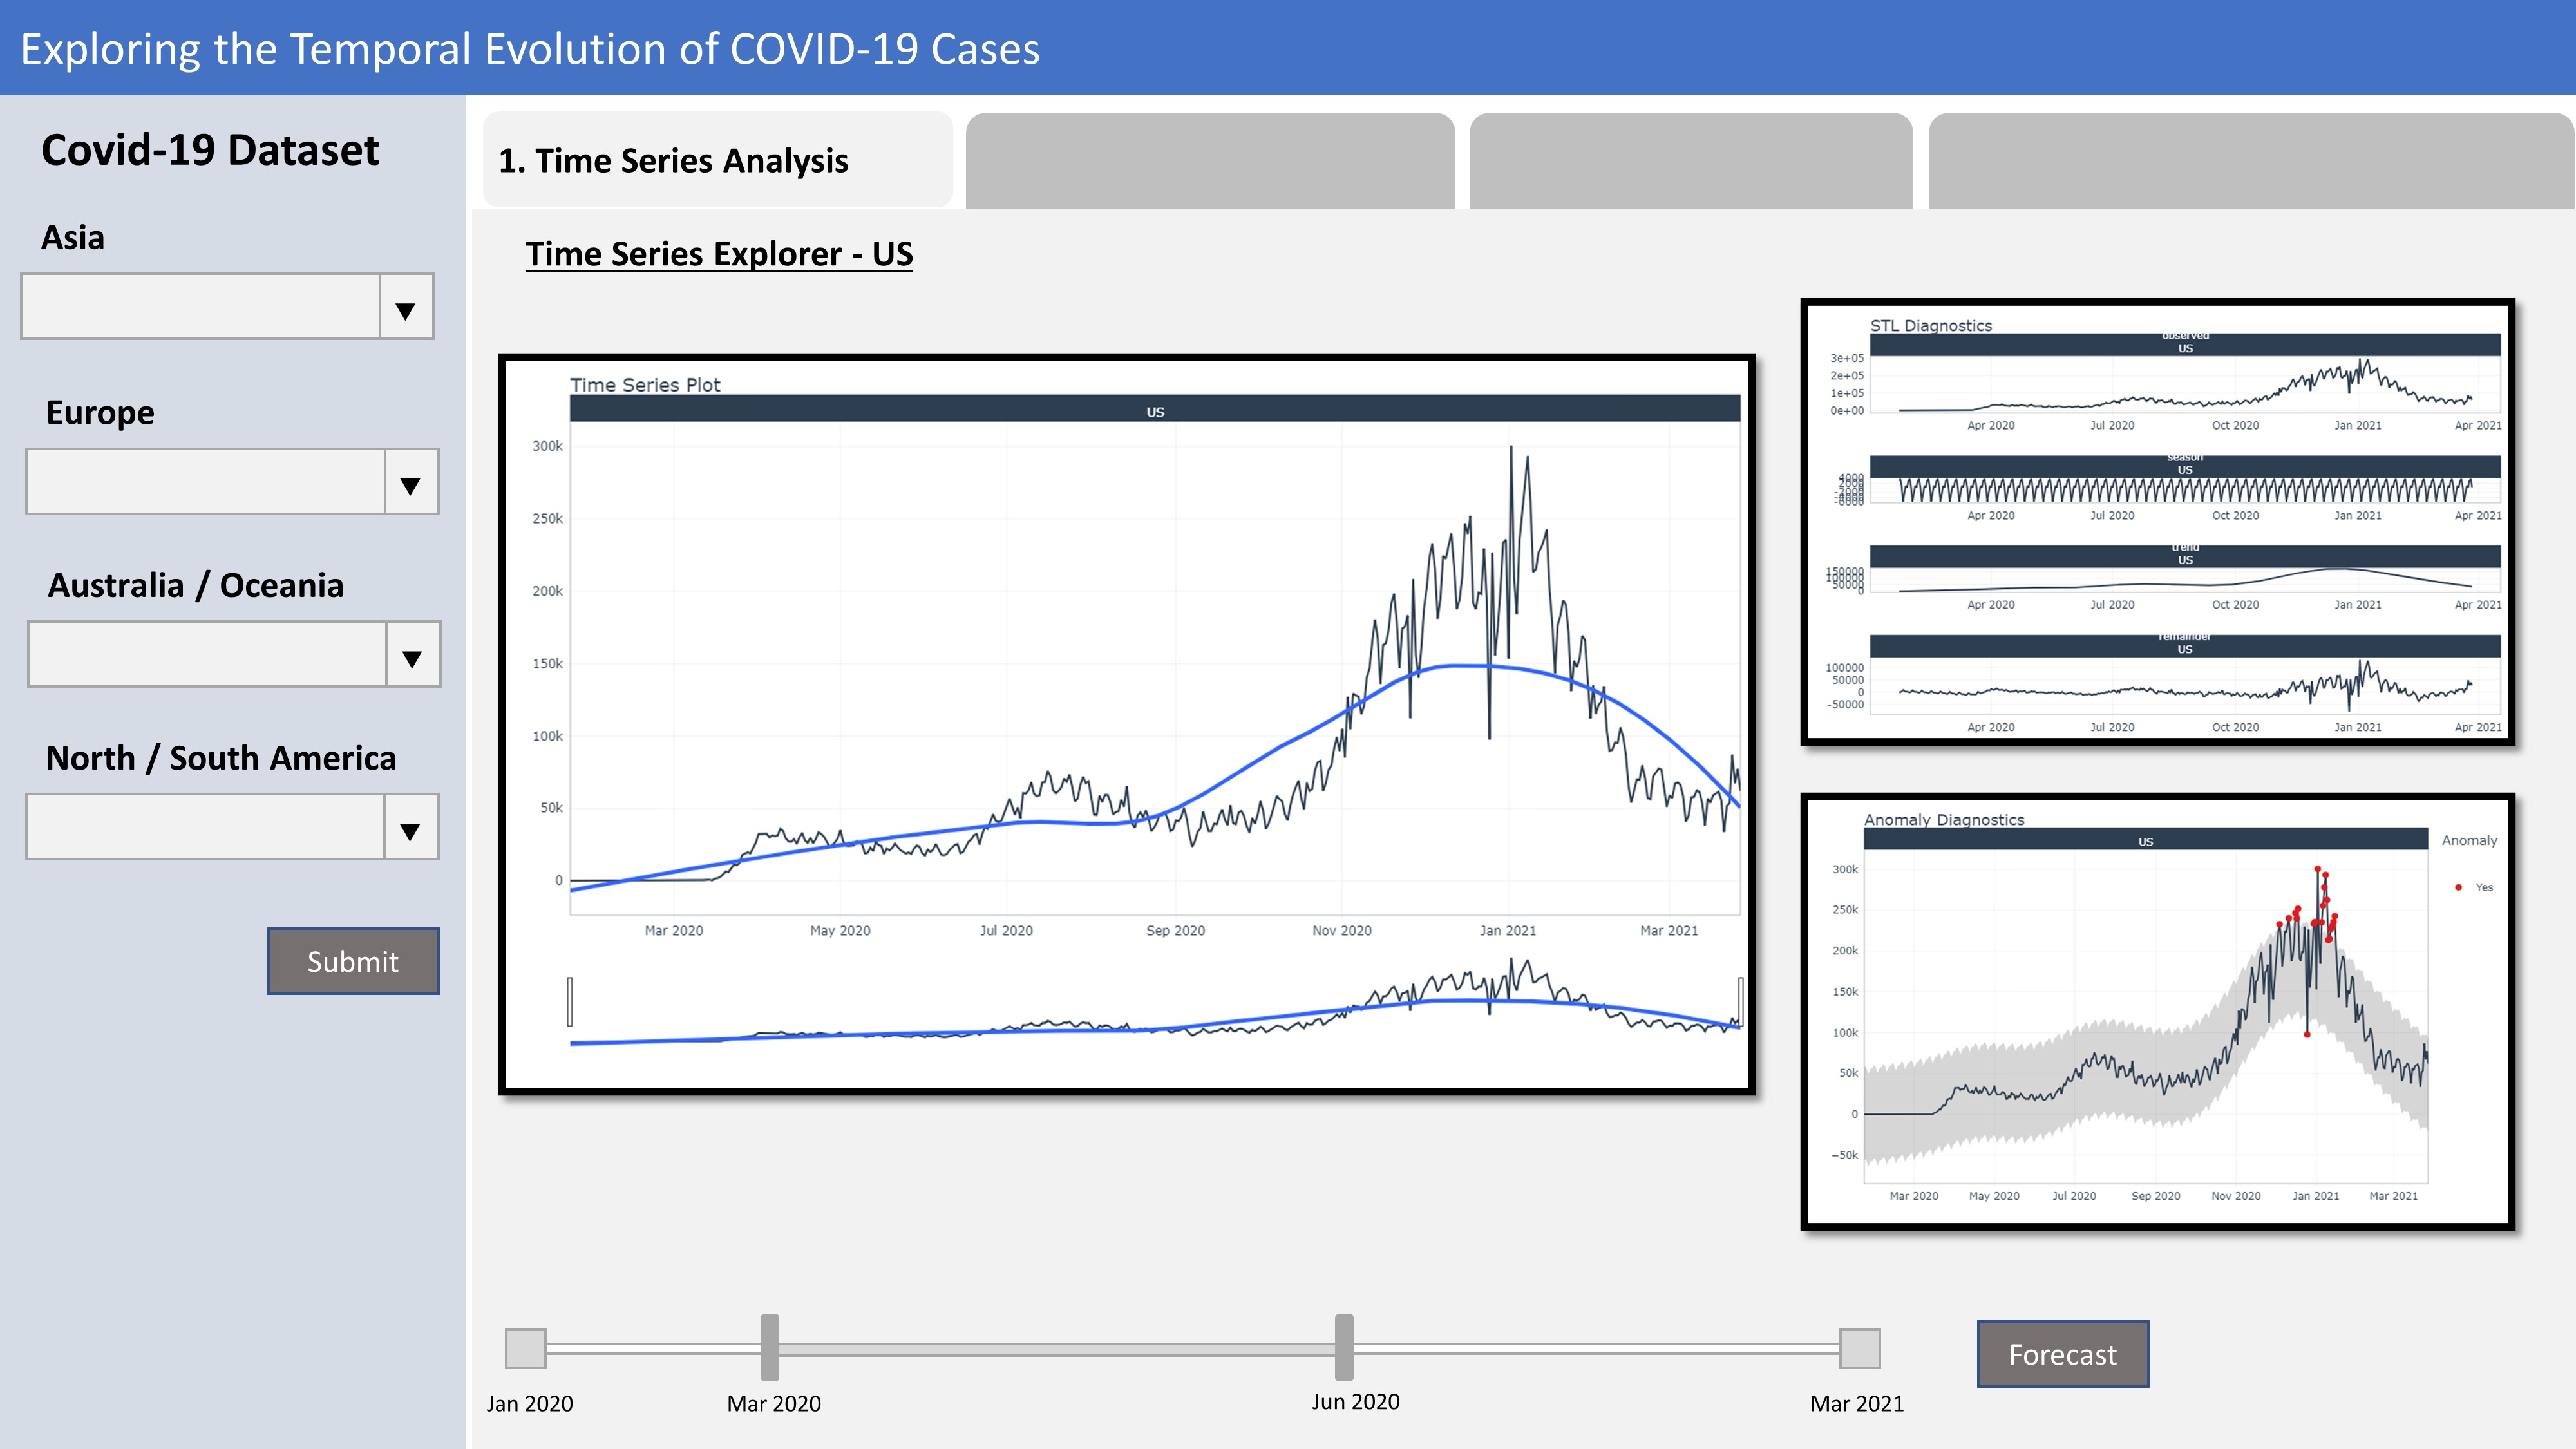
Exploring the Temporal Evolution of COVID-19 Cases
This post is on the planning and prototyping process for one of the three sub-modules of a Shiny-based Visual Analytics Application project for the course ISSS608. In this sub-module, the purpose is to investigate the spread of Coronavirus (COVID-19) over time for different countries and building models to forecast the near-future case load in each country, using the Johns Hopkins COVID-19 dataset.
Receptivity of Countries towards COVID-19 Vaccination
This post is a sub-module of the project and focuses on analysing countries' attitudes towards COVID-19 vaccination. Data for the analyses is obtained from the Imperial College London YouGov Covid 19 Behaviour Tracker Data Hub.
Visualisation and Analysis of Patient Psychosocial Acuity
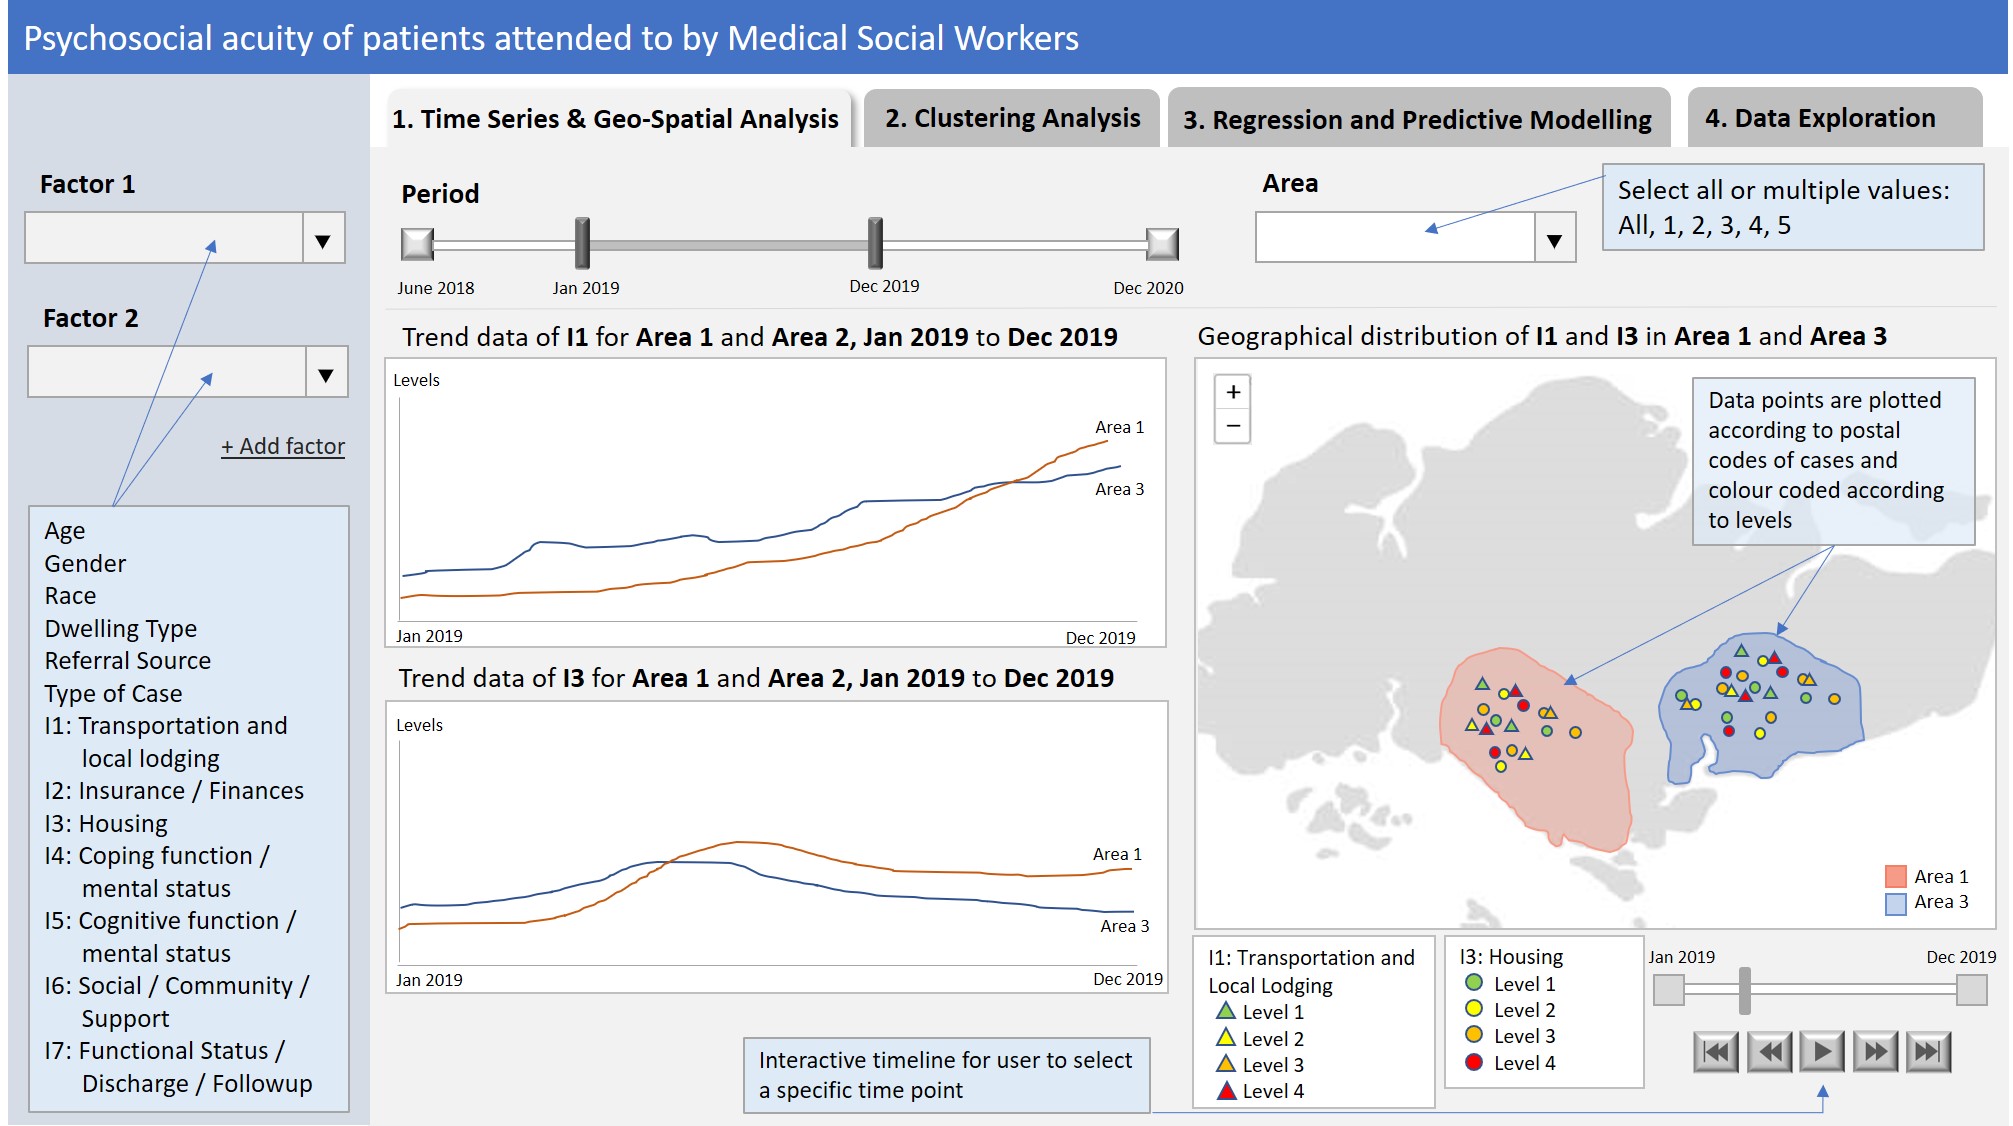
Project Proposal
Welcome to Our Blog
Welcome to our project blog for ISSS608 Visual Analytics and Applications, a course module offered in SMU MITB. We hope you enjoy reading what we have to say!